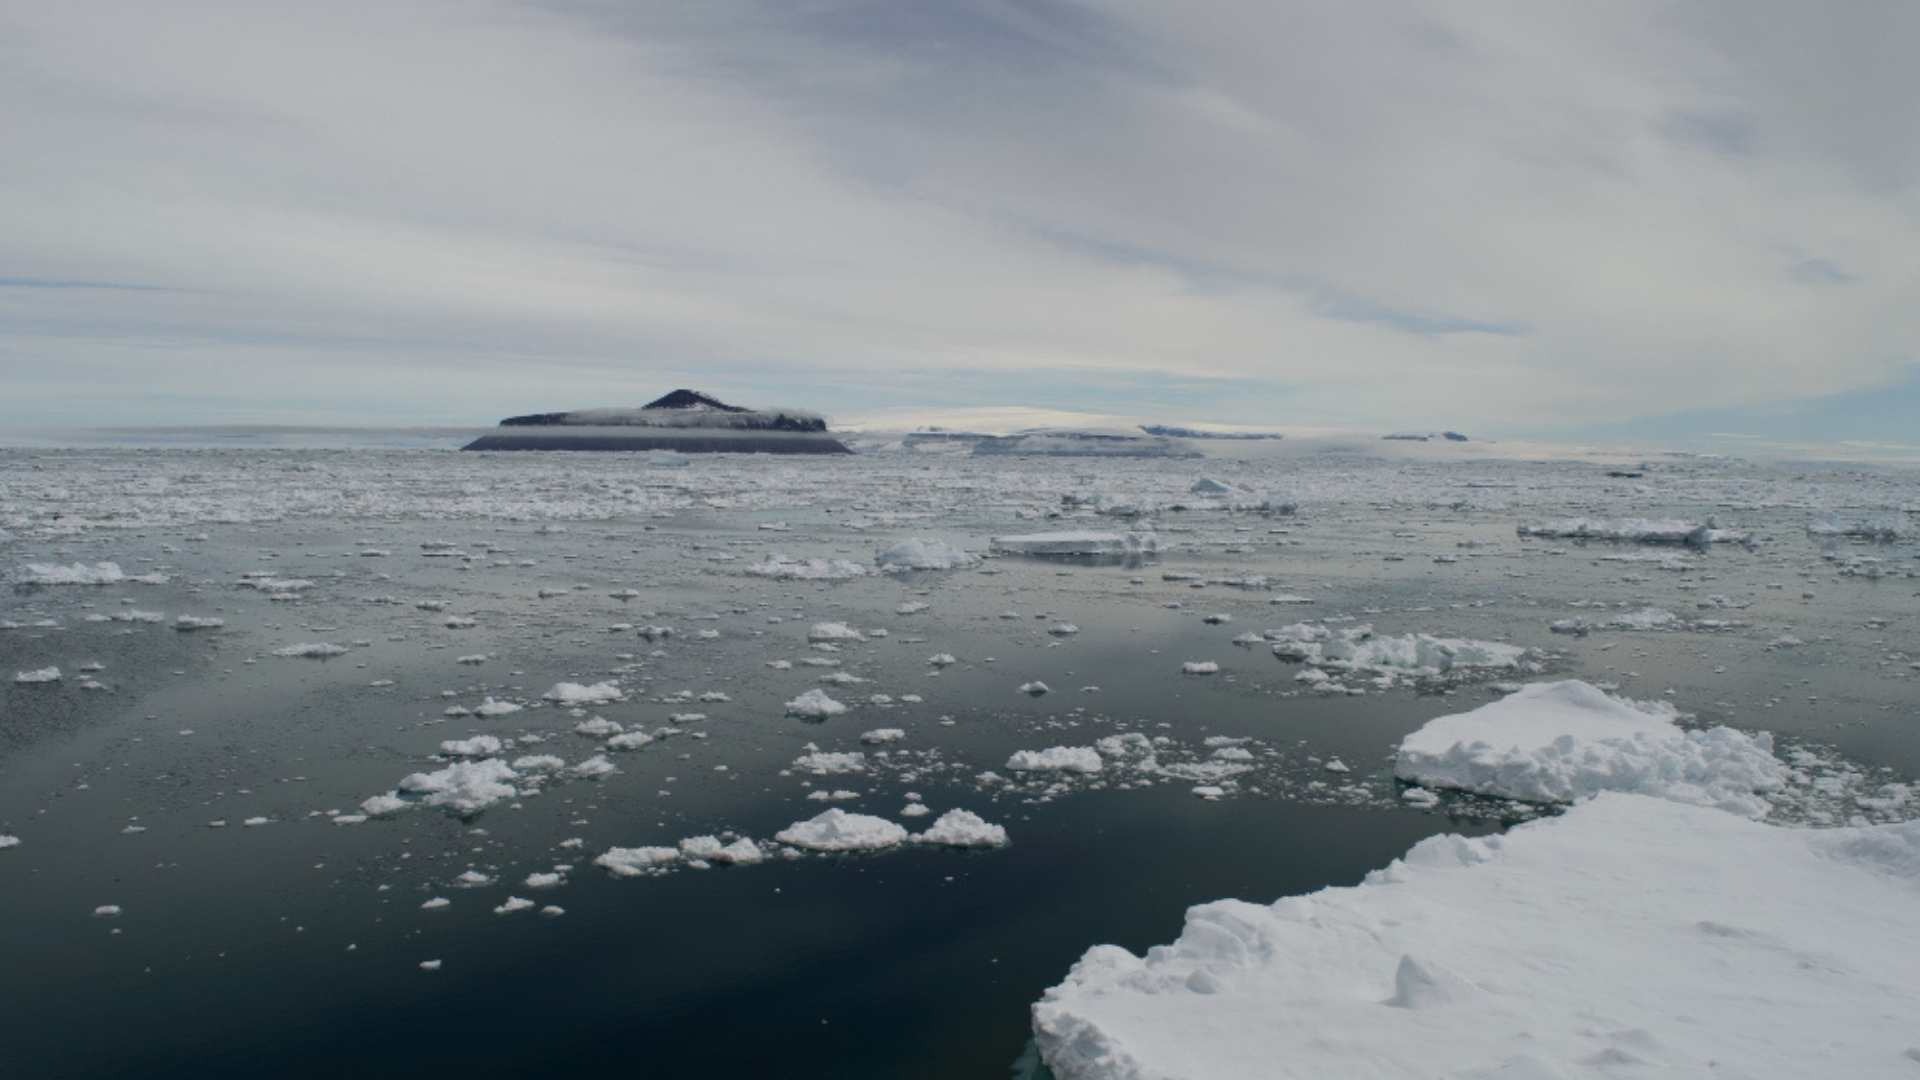
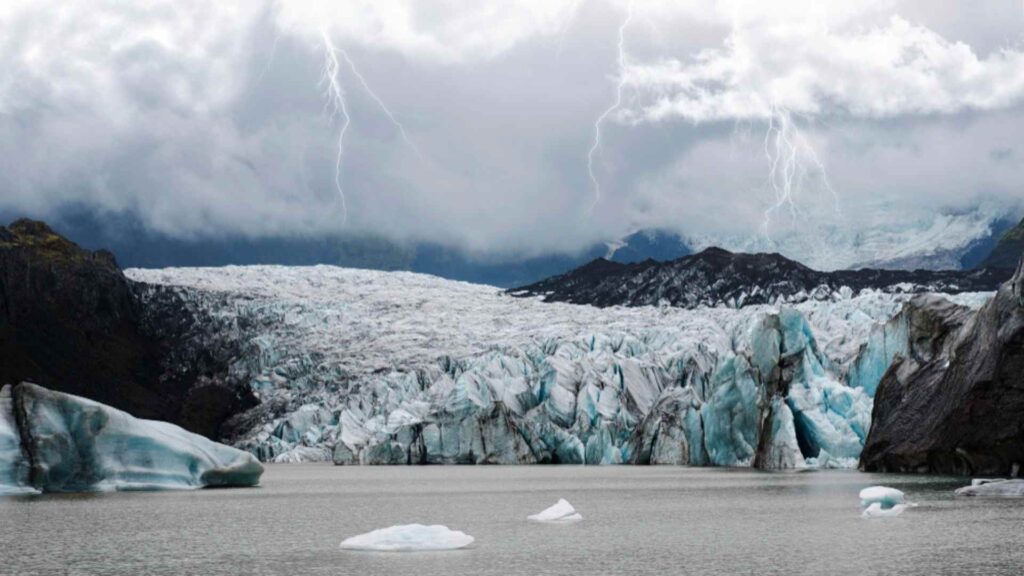
Antarctic ice shelf melting is redrawing the future of every coastline on the planet. Ice shelves are the floating extensions of Antarctica’s massive continental ice sheet, and they act as brakes on the glaciers behind them. When an ice shelf thins or collapses, those glaciers accelerate into the ocean, and sea levels rise. Over the past 25 years, every major Antarctic ice shelf has been losing mass, according to the Antarctic and Southern Ocean Coalition. The Thwaites Glacier alone has gone from shedding 10 billion tons of ice per year in the 1990s to over 80 billion tons per year by 2020. And on the opposite end of the globe, accelerating ice melt in Greenland is compounding the crisis, with the island’s ice sheet now losing roughly 270 billion tons per year according to NASA’s GRACE satellite data.
Table of Contents
This guide explains the mechanics behind Antarctic ice shelf melting, tracks the evidence of accelerating collapse, compares what is happening at both poles, and breaks down what the latest science (including peer-reviewed studies published as recently as 2026) says about the timeline, the consequences, and what can still be done. For the broader picture of how warming drives ice loss globally, see our guide on global warming and melting ice caps.
What Ice Shelves Are and Why They Matter
An ice shelf is a thick slab of ice that forms where a glacier or ice sheet flows off the land and out over the ocean. The ice floats on the water, but it remains attached to the ice on land. The largest, the Ross Ice Shelf, is nearly the size of France and rises more than 150 feet above the ocean surface at its edge, as the Antarctic and Southern Ocean Coalition documents in detail.
Ice shelves perform a critical function: they push back against the glaciers that feed them. As a shelf flows outward, it encounters obstacles (islands, underwater ridges, peninsulas) that create friction and slow the flow. This backward pressure, called buttressing, keeps the land-based ice behind the shelf from sliding into the ocean. When an ice shelf weakens, thins, or breaks apart, that buttressing force disappears and the glaciers behind it accelerate, sometimes dramatically.
After the partial collapse of the Larsen B ice shelf in 2002, glaciers flowing into the newly open water sped up by as much as eight times their prior rate, according to the Antarctic and Southern Ocean Coalition. That acceleration translates directly into ice entering the ocean and sea levels rising. The ice shelf itself, being already afloat, does not raise sea levels when it melts. But the land-based ice it was holding back does.
If the entire Antarctic Ice Sheet were to melt, global sea levels would rise by approximately 58 meters. That scenario is not imminent. But even partial destabilization of the West Antarctic Ice Sheet alone could produce more than three meters of sea-level rise over the coming centuries, reshaping coastlines worldwide.
How Antarctic Ice Shelf Melting Works
Three mechanisms drive the loss.
Warm Water Eroding Ice From Below
Warm ocean currents circulate beneath floating ice shelves, eating away at the ice from underneath. This submarine melting is the primary driver of Antarctic ice shelf melting today. Around Antarctica’s coastline, deep, relatively warm currents known as Circumpolar Deep Water are flowing onto the continental shelf and reaching the undersides of ice shelves with increasing frequency and volume.
A 2026 study published in Nature Communications revealed that the underside of many ice shelves is not smooth but grooved with long channel-like structures. These channels trap warm water in localized circulation cells, amplifying melt rates by roughly an order of magnitude compared to smooth sections. The research focused on the Fimbulisen Ice Shelf in East Antarctica, a region previously considered low-risk, and concluded that even small amounts of warmer water can substantially weaken these “cold” shelves.
Grounding Line Retreat
The grounding line is the point where the base of a glacier lifts off the bedrock and begins to float. As warm water melts the underside of the ice near this line, the glacier lifts further, pushing the grounding line inland. In many parts of West Antarctica, the bedrock slopes downward away from the coast, meaning that as the grounding line retreats, it exposes thicker ice to warm water, accelerating the process further. This geometry makes the West Antarctic Ice Sheet inherently unstable once retreat begins.
Surface Melt and Hydrofracture
In warmer years, meltwater pools on the surface of ice shelves. When those pools fill cracks in the ice, the weight of the water can force the cracks open all the way through the shelf, a process called hydrofracture. This is what scientists believe triggered the spectacular collapse of the Larsen B ice shelf. A 2026 Nature Communications study projected that the total area of Antarctica experiencing surface melt will expand by more than 10 percent by 2100 under moderate emissions scenarios, with the greatest increases concentrated in the West Antarctic Peninsula and the Amundsen Sea Embayment.
The Major Antarctic Collapses
Larsen A (1995)
The Larsen A section, located on the east coast of the Antarctic Peninsula, collapsed in January 1995 after being in place for approximately 4,000 years. The event was dramatic but relatively small. It served as an early warning.
Larsen B (2002)
In February 2002, a section of the Larsen B ice shelf covering 3,250 square kilometers (roughly the size of Yosemite National Park) disintegrated in approximately 35 days. The shelf had been stable for about 10,000 years, since the end of the last ice age. The Antarctic and Southern Ocean Coalition attributes the collapse to decades of warming that weakened the shelf from above (surface melt and hydrofracture) and below (ocean warming). After the collapse, glaciers flowing behind the shelf accelerated by up to eight times their previous speed, directly contributing to sea-level rise.
Thwaites: The Doomsday Glacier
The Thwaites Ice Shelf in West Antarctica is approximately the size of Florida and about 300 meters thick. It is the most closely watched piece of ice on the planet. In the 1990s, Thwaites was losing just over 10 billion tons of ice per year. By 2020, that figure had risen to roughly 80 billion tons, an eightfold increase in under three decades, according to NASA. Warm Circumpolar Deep Water is eroding the glacier’s grounding line, and the bedrock beneath Thwaites slopes downward inland, creating the conditions for runaway retreat. If Thwaites destabilizes completely, it could trigger a chain reaction across the broader West Antarctic Ice Sheet, potentially committing the world to over three meters of additional sea-level rise.
A 2023 study in Nature Climate Change found that rapid ocean warming in the Amundsen Sea (where Thwaites sits) is essentially committed over the remainder of this century, with no significant difference between mid-range emissions scenarios and the most ambitious Paris Agreement targets. The warming driving Antarctic ice shelf melting in this region may already be beyond the reach of emissions policy alone.
Accelerating Ice Melt in Greenland: The Other Polar Emergency
While Antarctica dominates the long-term sea-level picture, accelerating ice melt in Greenland is the more immediate crisis. Greenland’s ice sheet holds enough frozen water to raise sea levels by 7.4 meters. It is losing ice roughly twice as fast as Antarctica by annual mass, and surface melt (rather than submarine erosion) is the primary mechanism.
Key facts on accelerating ice melt in Greenland, drawn from NASA GRACE satellite data and a 2026 study in Nature Communications:
- Annual mass loss: approximately 264 to 270 billion tons per year (2002 to 2025).
- Rate of change: ice is melting approximately seven times faster now than in the 1990s.
- Record event: in summer 2019, a single heatwave caused Greenland to lose 532 billion tons of ice in just two months. Rivers of meltwater were visible from commercial aircraft.
- Extreme melt frequency: seven of the ten largest melt events since 1950 occurred after the year 2000. Meltwater production has risen from 12.7 gigatons per decade (1950 to 1975) to 82.4 gigatons per decade in recent decades.
- Area of melt expansion: extreme melt zones are expanding by approximately 2.8 million square kilometers per decade since 1990, reaching higher elevations on the ice sheet where no melt was previously observed.
- Surface darkening: mineral dust and glacier algae darken the ice surface, reducing its ability to reflect sunlight (albedo), which further accelerates melting.
Greenland’s accelerating ice melt is driven by Arctic amplification. The Arctic is warming roughly four times faster than the global average. This disproportionate warming supercharges summer melt seasons and makes extreme events (like 2019) increasingly likely. Our climate and global change coverage tracks these Arctic trends as they develop. For more on how warming is affecting species in the region, see our guide on Arctic wildlife.
Comparing the Two Polar Crises
| Indicator | Antarctica | Greenland |
| Total ice volume (sea-level equivalent) | ~58 meters | ~7.4 meters |
| Annual mass loss (current) | ~135 billion tons | ~264 to 270 billion tons |
| Primary melt mechanism | Ocean warming from below (ice shelf erosion) | Surface melt from above (atmospheric warming) |
| Rate of acceleration | Sixfold increase in loss over 30 years | Sevenfold increase since 1990s |
| Key glacier of concern | Thwaites (80 billion tons/year, grounding line retreating) | Jakobshavn (doubled speed in one decade) |
| Highest-profile collapse | Larsen B (3,250 sq km in 35 days, 2002) | Summer 2019 heatwave (532 billion tons in 2 months) |
| Warming rate vs global average | 2 to 3x in West Antarctica | ~4x (Arctic amplification) |
| Sea-level contribution (current) | ~0.4 mm/year | ~0.8 mm/year |
| Worst-case trajectory | West Antarctic Ice Sheet collapse (3+ meters) | Full sheet loss (7.4 meters) over centuries |
Both poles are losing ice at accelerating rates. The critical difference is mechanism: Antarctica is being attacked primarily from below by warming oceans, Greenland primarily from above by warming air. Both pathways lead to the same outcome: more water in the ocean, rising faster.
What This Means Beyond the Poles
Sea-Level Rise
Combined ice loss from Antarctica and Greenland currently adds roughly 1.2 millimeters per year to global sea levels, and the rate is increasing, according to NASA. Under moderate emissions scenarios, projections range from 30 to 60 centimeters of total rise by 2100. Under high-emissions pathways, the range extends beyond one meter, with tail-risk scenarios (triggered by rapid ice sheet collapse) reaching significantly higher. Our nature and wildlife section covers the cascading ecological effects of these changes across marine and coastal ecosystems.
Weather Disruption
As polar ice disappears, the temperature gradient between the poles and the tropics shrinks, destabilizing the jet stream. This produces longer, more intense heat waves, deeper cold outbreaks, and more erratic precipitation in mid-latitude regions where most of the world’s population lives.
Ocean Circulation
Massive volumes of cold, fresh meltwater pouring into the North Atlantic (from Greenland) and the Southern Ocean (from Antarctica) may be disrupting the thermohaline circulation that regulates global heat distribution. Evidence is growing that the Atlantic Meridional Overturning Circulation (AMOC) is slowing, with potentially severe consequences for European climate and tropical monsoon systems.
Food and Water Security
Mountain glaciers (separate from the polar ice sheets but responding to the same warming) supply water to billions of people across South America, Central Asia, and the Himalayas. Their retreat threatens irrigation, hydropower, and drinking water on timescales measured in decades, not centuries. For a broader look at how ecosystem disruption propagates through food systems, our piece on what would happen if bees disappeared illustrates the interconnected nature of these risks. For more on how ice loss connects to the broader polar ice caps melting picture, follow our dedicated coverage.
What Can Be Done
Antarctic ice shelf melting and accelerating ice melt in Greenland are both driven by the same root cause: the buildup of greenhouse gases in the atmosphere from fossil fuel combustion, deforestation, and industrial agriculture.
Emissions reduction remains the single highest-impact action. Every fraction of a degree of avoided warming slows ice loss and reduces the probability of crossing irreversible tipping points.
Black carbon and aerosol reduction offers near-term gains, particularly for Greenland, where soot and dust deposition darken the ice surface and accelerate absorption of solar energy. Our coverage of solutions to reduce air pollution details specific policy and technology approaches.
Coastal adaptation is now essential regardless of future emissions. Seawalls, managed retreat programs, updated flood maps, and infrastructure redesign for rising water are not optional extras. They are immediate needs.
Research funding must keep pace with the crisis. Key monitoring programs (including NASA GRACE-FO and the National Snow and Ice Data Center’s Ice Sheets Today) face funding uncertainty precisely when their data is most needed for planning.
For a personal starting point, our sustainability assessment andeco tools can help quantify your own household footprint and identify the highest-impact changes available to you.
What is the difference between an ice shelf and an ice sheet?
An ice sheet is a massive body of glacial ice covering land (Antarctica and Greenland are the only two on Earth). An ice shelf is the floating extension where an ice sheet flows off the land and over the ocean. Ice shelves act as buttresses that slow the flow of land-based ice into the sea. When an ice shelf melts or collapses, the glaciers behind it accelerate, contributing directly to sea-level rise.
Is the Thwaites Glacier going to collapse?
The timing is uncertain, but the trajectory is concerning. Thwaites has increased its annual ice loss eightfold in three decades, and the bedrock beneath it slopes downward inland, creating conditions for runaway retreat. A 2023 Nature Climate Change study found that the ocean warming driving Thwaites’ erosion is essentially committed regardless of near-term emissions reductions. Full collapse is not imminent but cannot be ruled out within this century.
Why is Greenland melting faster than Antarctica?
Greenland sits in the Arctic, which is warming approximately four times faster than the global average due to Arctic amplification. This intense atmospheric warming drives surface melt, which is Greenland’s primary loss mechanism. Antarctica’s primary loss mechanism is submarine erosion by warm ocean currents, which operates more slowly but affects a vastly larger volume of ice.
Can polar ice grow back?
Ice sheets take thousands of years to form. Even if warming stopped entirely today, the heat already in the ocean would continue driving Antarctic ice shelf melting for decades. Greenland’s accelerating ice melt would also continue on inertia. Aggressive emissions reduction can slow the loss and potentially prevent crossing irreversible tipping points, but recovering lost ice on human timescales is not realistic.
How does polar ice loss affect people who live nowhere near the poles?
Three direct pathways: sea-level rise threatens every coastal community on Earth; disruption of the jet stream and ocean currents alters weather patterns far from the poles, producing heat waves, droughts, and extreme cold events in mid-latitudes; and mountain glacier retreat (driven by the same warming) threatens freshwater and food supplies for billions of people in Asia, South America, and beyond.
What is the single most important thing an individual can do?
Reduce your household carbon footprint (energy, transport, diet) and advocate for systemic change (renewable energy policy, fossil fuel phase-out, international climate agreements). Individual action alone cannot solve the problem, but collective action aggregated across millions of households shifts political and economic incentives toward the structural changes that can.
Sources
- Antarctic and Southern Ocean Coalition. “Melting Ice Shelves.” https://www.asoc.org/learn/melting-ice-shelves/
- National Aeronautics and Space Administration. “Ice Sheets: Earth Indicator.” https://science.nasa.gov/earth/explore/earth-indicators/ice-sheets/
- Nature Climate Change. “Unavoidable Future Increase in West Antarctic Ice-Shelf Melting over the Twenty-First Century.” https://www.nature.com/articles/s41558-023-01818-x
- Nature Communications. “Record-Breaking Greenland Ice Sheet Melt Events Under Recent and Future Climate.” https://www.nature.com/articles/s41467-026-69543-5
- Nature Communications. “Channelized Topography Amplifies Melt-Sensitivity of Cold Antarctic Ice Shelves.” https://www.nature.com/articles/s41467-026-71828-8